QCEVault

Ecosystems and succession practice

QCE Biology · Original practice questions with worked solutions

Practise food webs, productivity, nutrient cycles and ecological succession. Relate observations to energy transfer and changes in environmental conditions.

Key ideas

  • Food-web arrows indicate the direction of energy transfer, from the organism consumed to its consumer.
  • Energy-transfer efficiency is 100×energy at the receiving level/energy at the source level100\times\text{energy at the receiving level}/\text{energy at the source level}. Use comparable units.
  • Primary succession begins where a developed soil community is absent; secondary succession follows disturbance where relevant soil or biological material remains.

Worked example

If producers contain 20 00020\,000 energy units and primary consumers receive 20002000, the transfer efficiency is 10%10\%.

A common mistake

Energy flows through an ecosystem and is dissipated; nutrients cycle through biotic and abiotic components.

Try these questions

Attempt each question before revealing the worked solution. Saved questions and checked answers also appear in the main bank on this device. Exam marks are recorded after marking a practice exam.

Q9 · Practice questionSimple familiar1 mark

QUESTION 9

A wetland has gross primary productivity of 2400 kJm−2year−1 and producer respiration of 900 kJm−2year−1. Its net primary productivity is

(A)
3300 kJm−2year−1
(B)
900 kJm−2year−1
(C)
1500 kJm−2year−1
(D)
2400 kJm−2year−1
Question link
Q46 · Practice questionComplex familiar7 marks

QUESTION 46 (7 marks)

The diagram shows an annual energy budget. All values are in kJm−2year−1. The producer input is gross primary productivity. Assume the grazer energy budget is complete.
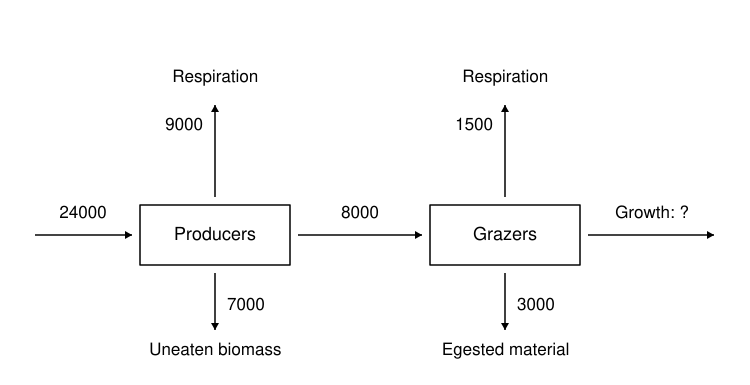
Biology question figure. Context: The diagram shows an annual energy budget. All values are in kJm−2year−1. The producer input is gross primary productivity. Assume the grazer energy budget is complete.. Visible labels: RespirationRespiration; 90001500; 240008000Growth:?; ProducersGrazers; 70003000; UneatenbiomassEgestedmaterial

a) Calculate net primary productivity. [1 marks]

b) Calculate energy stored in new grazer biomass. [2 marks]

c) Calculate the efficiency of transfer from producer net production to new grazer biomass. [2 marks]

d) Explain why the energy available to the next trophic level is lower than grazer food intake. [2 marks]

Question link
Q47 · Practice questionComplex familiar6 marks

QUESTION 47 (6 marks)

A sealed terrarium contains plants, small herbivores and decomposers. Its measured carbon flows are shown. Assume the table includes all transfers between atmospheric CO₂ and living organisms during this day.
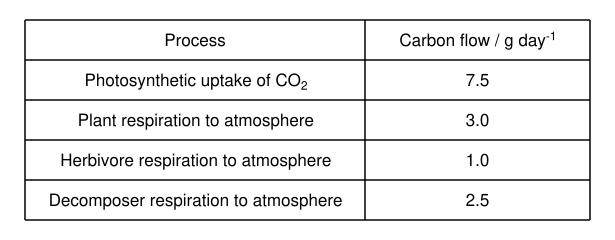
Biology question figure. Context: A sealed terrarium contains plants, small herbivores and decomposers. Its measured carbon flows are shown. Assume the table includes all transfers between atmospheric CO₂ and living organisms during this day.. Visible labels: -1; ProcessCarbonflow/gday; PhotosyntheticuptakeofCO7.5; 2; Plantrespirationtoatmosphere3.0; Herbivorerespirationtoatmosphere1.0; Decomposerrespirationtoatmosphere2.5

a) Determine the net change in atmospheric carbon, in grams, over the day. [2 marks]

b) Describe how photosynthesis transforms carbon and how feeding transfers carbon. [2 marks]

c) Explain why carbon can cycle through this terrarium while useful energy still needs an external input. [2 marks]

Question link

All ecosystems and succession practice questions

36 original questions · Page 1 of 2

  1. Q9 · Original practice · 1 mark
    A wetland has gross primary productivity of 2400 kJ m−2 year−12400\ \mathrm{kJ\,m^{-2}\,year^{-1}} and producer respiration of 900 kJ m−2 year−1900\ \mathrm{kJ\,m^{-2}\,year^{-1}}. Its net primary productivity is
    Functioning ecosystems and succession
  2. Q10 · Original practice · 1 mark
    In a pond, producers store 18000 kJ in new biomass during a month. Primary consumers store 1800 kJ and secondary consumers store 144 kJ. The transfer efficiency from primary to secondary consumers is
    Functioning ecosystems and succession
  3. Q11 · Original practice · 1 mark
    Which organism occupies both the second and third trophic levels in the food web?
    Functioning ecosystems and succession
  4. Q12 · Original practice · 1 mark
    Which conversion is carried out by nitrifying bacteria in the nitrogen cycle?
    Functioning ecosystems and succession
  5. Q13 · Original practice · 1 mark
    Lichens begin colonising a newly exposed lava flow with no soil. This is an example of
    Functioning ecosystems and succession
  6. Q14 · Original practice · 1 mark
    An orchid uses a tree branch for support. It gains better access to light, while measurements show no detectable effect on the tree. The interaction described is
    Functioning ecosystems and succession
  7. Q15 · Original practice · 1 mark
    Two protist species use the same limiting food source. When cultured together, their populations follow the graph. Which conclusion is best supported?
    Functioning ecosystems and succession
  8. Q46 · Original practice · 7 marks
    The diagram shows an annual energy budget. All values are in kJ m−2 year−1\mathrm{kJ\,m^{-2}\,year^{-1}}. The producer input is gross primary productivity. Assume the grazer energy budget is complete.
    Functioning ecosystems and succession
  9. Q47 · Original practice · 6 marks
    A sealed terrarium contains plants, small herbivores and decomposers. Its measured carbon flows are shown. Assume the table includes all transfers between atmospheric CO₂ and living organisms during this day.
    Functioning ecosystems and succession
  10. Q48 · Original practice · 6 marks
    The diagram shows selected nitrogen-cycle transformations. Letters represent biological processes.
    Functioning ecosystems and succession
  11. Q49 · Original practice · 4 marks
    A water molecule enters a plant through its roots. Some of this water is later released from the leaves; some is used in photosynthesis.
    Functioning ecosystems and succession
  12. Q50 · Original practice · 5 marks
    A lake has a standing biomass of 18 kg of phytoplankton and 54 kg of zooplankton at one sampling time. Over the month, new biomass production is 900 kg for phytoplankton and 90 kg for zooplankton.
    Functioning ecosystems and succession
  13. Q51 · Original practice · 5 marks
    The graph shows counts of a prey species and a predator species in a reserve. Solid and dashed lines are identified in the key.
    Functioning ecosystems and succession
  14. Q52 · Original practice · 5 marks
    Researchers remove a predatory sea star from one experimental reef plot. A similar plot is left unchanged. Initial species richness is 12 in both. After one year, results are as shown.
    Functioning ecosystems and succession
  15. Q53 · Original practice · 4 marks
    Two grass species grow along a moisture gradient. When each is grown alone, both occur across the full gradient. When grown together, species P occupies wetter sites and Q occupies drier sites.
    Functioning ecosystems and succession
  16. Q54 · Original practice · 5 marks
    Three relationships are observed: a tick feeds on a wallaby; a fungus supplies a plant with mineral nutrients while receiving sugars; a barnacle gains transport on a whale without a measurable effect on the whale.
    Functioning ecosystems and succession
  17. Q55 · Original practice · 5 marks
    A fertiliser spill increases available nitrogen in a lake. Algal biomass rises sharply, then dissolved oxygen falls after much of the algae dies.
    Functioning ecosystems and succession
  18. Q56 · Original practice · 5 marks
    A reserve supports a herbivore population. A prolonged drought begins at month 8. The table records the carrying capacity estimated from resource availability.
    Functioning ecosystems and succession
  19. Q57 · Original practice · 6 marks
    Site A is a newly exposed rock surface after a glacier retreats. Site B is a burnt grassland where soil, roots and a seed bank remain.
    Functioning ecosystems and succession
  20. Q58 · Original practice · 5 marks
    The graph shows percentage cover of three plant groups after a disturbance. Cover values describe each group separately and may overlap vertically.
    Functioning ecosystems and succession
  21. Q59 · Original practice · 5 marks
    Two equal-area farm plots are surveyed using the same method. Plot M is a monoculture; plot D contains several crop species. The table summarises their arthropod communities.
    Functioning ecosystems and succession
  22. Q60 · Original practice · 6 marks
    Large fish are removed from the food web. Assume feeding links remain unchanged and food, rather than habitat space, limits the grazing snails and insect larvae.
    Functioning ecosystems and succession
  23. Q93 · Original practice · 9 marks
    A grassland fire leaves soil and a seed bank intact. As shrubs establish, light reaching the ground decreases. In one diploid annual herb, allele S increases shade tolerance. The table shows complete genotype counts before the fire and after several generations of succession. Assume no immigration or new mutations during this period.
    Functioning ecosystems and succession
  24. Q94 · Original practice · 8 marks
    A hypothetical reserve contains dingoes, browsing wallabies and young trees. After dingo numbers recover, wallaby abundance falls and tree growth increases. The carbon table includes all photosynthetic uptake and biotic respiratory return for the measured plots; assume other carbon exchanges are negligible.
    Functioning ecosystems and succession