QUESTION 51 (5 marks)
The graph shows counts of a prey species and a predator species in a reserve. Solid and dashed lines are identified in the key.
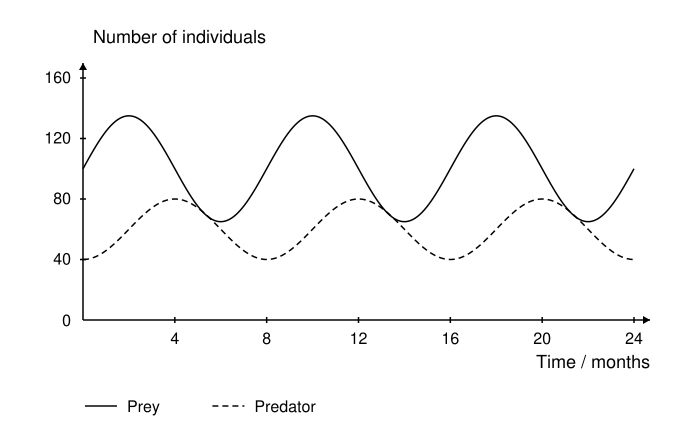
a) Estimate the time lag between a prey peak and the next predator peak. [1 marks]
b) Explain a mechanism that could produce this lag. [3 marks]
c) Explain why these two curves alone do not establish that predation is the only cause of the cycles. [1 marks]
Practice marking scheme
Answer
a) About 2 months. b) More prey increases food availability, improving predator survival/reproduction; predator numbers rise later. c) Other changing factors may affect both populations.
Working
Prey peaks occur near months 2, 10 and 18; predator peaks occur near 4, 12 and 20. Increased prey availability can improve predator survival and reproductive success, but population growth takes time. Later increased predation may reduce prey abundance. Weather, disease or resource changes could also contribute, so the graph supports a plausible interaction rather than proving a unique mechanism.
Marking criteria
- Estimates a 2-month lag. [1 mark]
- Links higher prey abundance to greater predator food availability. [1 mark]
- Links food availability to predator survival/reproduction. [1 mark]
- Explains a delay before predator numbers respond. [1 mark]
- Identifies a plausible additional influence or lack of causal isolation. [1 mark]
Practice question aligned to the current QCAA syllabus; review the worked solution and marking criteria.
View the QCAA syllabusCompare your working with the guide above.