Q2 · 2025 · Paper 1Unclassified1 mark
QUESTION 2
The diagram shows energy flow through an ecosystem in kJ m−2 year−1. Shaded boxes represent
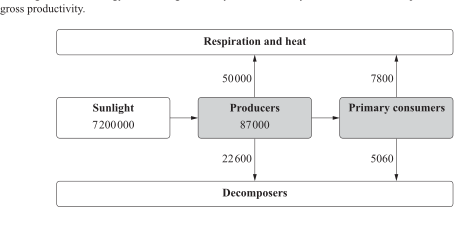
7800 | |
Primary consumers | |
5060 | |
Calculate the percentage of solar energy available to primary consumers.
(A) 0.1%
(B) 0.2%
(C) 0.4%
(D) 0.5%
WORKED SOLUTION
1 markAnswer B
OFFICIAL ANSWERB
QCAA awards 1 mark for selecting option B.
Correct option from the official QCAA answer key.