QCEVault

Biodiversity and populations practice

QCE Biology · Original practice questions with worked solutions

Practise biodiversity measures, population estimates and interpreting sampling evidence. Explain what a measure represents and evaluate whether the sampling method supports the conclusion.

Key ideas

  • Species richness counts species; evenness describes how evenly individuals are distributed among species. Communities with the same richness can have different diversity.
  • Choose quadrats, transects or other sampling methods appropriate to the organisms and question. Replication and representative sampling help improve an estimate.
  • For the simple mark–recapture estimate, N≈MC/RN\approx MC/R, where MM is initially marked, CC is the later sample and RR is recaptured marked individuals.

Worked example

If 40 individuals are marked, a later sample contains 50 individuals and 10 are marked, the estimate is N≈40×50/10=200N\approx40\times50/10=200 individuals.

A common mistake

Mark–recapture depends on assumptions such as mixing, retained marks and a sufficiently closed population. State relevant limitations when evaluating a result.

Try these questions

Attempt each question before revealing the worked solution. Saved questions and marks also appear in the main bank on this device.

Q1 · Practice questionSimple familiar1 mark

QUESTION 1

Which observation identifies a limitation of the biological species concept?

(A)
Members of a species can have different body sizes.
(B)
Asexual organisms cannot be classified using interbreeding criteria.
(C)
Members of a species can live in different habitats.
(D)
A species can contain several alleles of one gene.
Question linkSyllabus coverage
Q31 · Practice questionSimple familiar5 marks

QUESTION 31 (5 marks)

A floodplain contains reed beds, open water and woodland. Surveys record 32 bird species. Within one duck species, individuals carry different alleles for bill colour.

a) Identify the three levels of biodiversity represented, linking each to one observation. [3 marks]

b) Explain why counting bird species alone cannot describe all the biodiversity of this floodplain. [2 marks]

Question linkSyllabus coverage
Q32 · Practice questionComplex familiar6 marks

QUESTION 32 (6 marks)

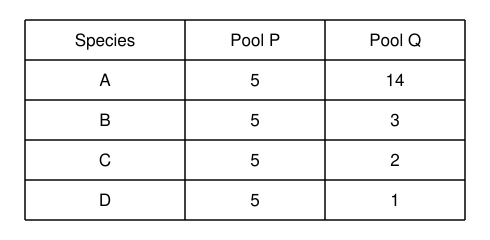
Equal-sized samples from two rock pools contain the animals shown. Use SDI=1−∑n(n−1)N(N−1).

Biology diagram for BIO26-ORIG-032

a) Calculate Simpson’s diversity index for each pool. Show working and give values to three decimal places. [3 marks]

b) Compare species richness and evenness in the two samples. [2 marks]

c) State which pool has greater species diversity and justify using your results. [1 marks]

Question linkSyllabus coverage

All biodiversity and populations practice questions

39 original questions · Page 1 of 2

  1. Q1 · Original practice · 1 mark
    Which observation identifies a limitation of the biological species concept?
    Biodiversity and populations
  2. Q2 · Original practice · 1 mark
    A ranger marks and releases 48 freshwater turtles. After the marks have mixed through the population, 60 turtles are caught; 12 are marked. Using the Lincoln index, the estimated population size is
    Biodiversity and populations
  3. Q3 · Original practice · 1 mark
    A sample contains 10 individuals of species A and 10 of species B. Use SDI=1−∑n(n−1)N(N−1)SDI=1-\dfrac{\sum n(n-1)}{N(N-1)}. Its Simpson’s diversity index is closest to
    Biodiversity and populations
  4. Q4 · Original practice · 1 mark
    A grass species occurs in 9 of 15 quadrats. What is its percentage frequency?
    Biodiversity and populations
  5. Q5 · Original practice · 1 mark
    Use the dichotomous key to identify an organism with no wings and eight legs.
    Biodiversity and populations
  6. Q6 · Original practice · 1 mark
    The graph shows a population growing in a closed habitat. Which explanation best accounts for the shape after day 10?
    Biodiversity and populations
  7. Q7 · Original practice · 1 mark
    A community’s tallest stratum consists of 18 m trees with 45% foliage projective cover. Using the supplied Specht classification excerpt, classify the community.
    Biodiversity and populations
  8. Q8 · Original practice · 1 mark
    A population initially contains 400 lizards. During one month there are 55 births, 32 deaths, 18 immigrants and 21 emigrants. Its net change is
    Biodiversity and populations
  9. Q31 · Original practice · 5 marks
    A floodplain contains reed beds, open water and woodland. Surveys record 32 bird species. Within one duck species, individuals carry different alleles for bill colour.
    Biodiversity and populations
  10. Q32 · Original practice · 6 marks
    Equal-sized samples from two rock pools contain the animals shown. Use SDI=1−∑n(n−1)N(N−1)SDI=1-\dfrac{\sum n(n-1)}{N(N-1)}.
    Biodiversity and populations
  11. Q33 · Original practice · 5 marks
    Researchers randomly locate eight 0.50 m² quadrats in a uniform 240 m² meadow. They count 3, 7, 4, 6, 5, 4, 8 and 3 orchid plants.
    Biodiversity and populations
  12. Q34 · Original practice · 5 marks
    A saltmarsh reserve is 60% low marsh and 40% upper marsh. The habitats differ in flooding frequency and vegetation. Twenty quadrats can be sampled.
    Biodiversity and populations
  13. Q35 · Original practice · 5 marks
    Forty possums are captured, marked and released. A second capture contains 50 possums, of which 10 are marked.
    Biodiversity and populations
  14. Q36 · Original practice · 5 marks
    The graph shows the mean number of seedlings per 1 m² quadrat at locations along a dune transect. Soil salinity decreases with increasing distance from the shore.
    Biodiversity and populations
  15. Q37 · Original practice · 4 marks
    Five quadrats were divided into 25 equal grid cells. The table records the number of cells occupied by a shrub in each quadrat. A cell was counted if at least half its area was covered.
    Biodiversity and populations
  16. Q38 · Original practice · 4 marks
    A biologist uses the key to identify four hypothetical insect species. The specimen has unbranched antennae, spotted wings and no tail filaments.
    Biodiversity and populations
  17. Q39 · Original practice · 4 marks
    The table shows selected taxonomic information for three hypothetical beetles.
    Biodiversity and populations
  18. Q40 · Original practice · 4 marks
    In a forest, trees 16 m tall form the highest vegetation stratum. Their foliage projective cover falls from 55% to 22% after a cyclone. Shrub cover remains 80%. Use the supplied Specht excerpt.
    Biodiversity and populations
  19. Q41 · Original practice · 4 marks
    An investigator uses the supplied simplified Holdridge excerpt. A site has annual biotemperature 20 °C and a potential evapotranspiration-to-precipitation ratio of 0.70. Treat boundaries exactly as listed.
    Biodiversity and populations
  20. Q42 · Original practice · 5 marks
    An annual survey of a bird colony begins with 750 individuals. Over one year there are 140 births, 95 deaths, 32 immigrants and 47 emigrants.
    Biodiversity and populations
  21. Q43 · Original practice · 5 marks
    The two curves show population sizes in different habitats. Curve P is solid and curve Q is dashed.
    Biodiversity and populations
  22. Q44 · Original practice · 5 marks
    Two hypothetical plants have the life-history characteristics shown.
    Biodiversity and populations
  23. Q45 · Original practice · 5 marks
    Two teams independently sample equal areas of a grassland using the same quadrat size. Team A selects the five greenest patches. Team B uses 25 random locations. Their SDI estimates are 0.82 and 0.61 respectively.
    Biodiversity and populations
  24. Q91 · Original practice · 9 marks
    A storm changes a pond community. Equal-sized macroinvertebrate samples and annual producer/grazer energy data are shown. Use SDI=1−∑n(n−1)N(N−1)SDI=1-\dfrac{\sum n(n-1)}{N(N-1)}.
    Biodiversity and populations