QUESTION 91 (9 marks)
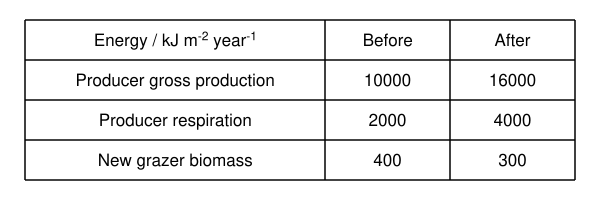
A storm changes a pond community. Equal-sized macroinvertebrate samples and annual producer/grazer energy data are shown. Use .
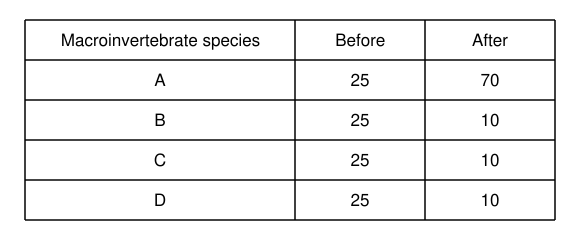
a) Calculate SDI before and after the storm, giving three decimal places. [3 marks]
b) Compare richness and evenness before and after the storm. [2 marks]
c) Calculate post-storm producer NPP and the efficiency of transfer from that NPP to new grazer biomass. [2 marks]
d) A student claims that higher producer productivity proves biodiversity improved. Explain whether the evidence supports the claim. [2 marks]
Practice marking scheme
Answer
a) 0.758 before; 0.485 after. b) Richness remains 4; evenness falls. c) NPP = 12000 kJ m⁻² year⁻¹; transfer = 2.5%. d) No: productivity rose, but the diversity index and evenness fell.
Working
Each sample has . Before: . After: . Richness stays at four, but species A becomes dominant. Post-storm and grazer transfer efficiency is . More producer production is a different quantity from species diversity; the sampled community became less even and had lower SDI.
Marking criteria
- Uses N = 100 and the finite-sample formula. [1 mark]
- Calculates pre-storm SDI 0.758. [1 mark]
- Calculates post-storm SDI 0.485. [1 mark]
- States that richness remains four. [1 mark]
- Identifies lower evenness after the storm. [1 mark]
- Calculates NPP 12000. [1 mark]
- Calculates transfer efficiency 2.5%. [1 mark]
- Rejects the inference that higher productivity proves greater biodiversity. [1 mark]
- Uses the reduced SDI/evenness to support rejection. [1 mark]
Practice question aligned to the current QCAA syllabus; review the worked solution and marking criteria.
View the QCAA syllabusCompare your working with the guide above.