QUESTION 43 (5 marks)
The two curves show population sizes in different habitats. Curve P is solid and curve Q is dashed.
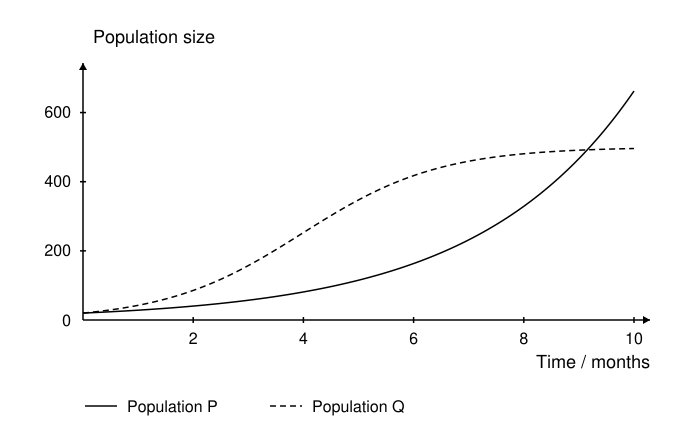
a) Identify the growth mode of each population. [2 marks]
b) Estimate the carrying capacity of Q. [1 marks]
c) Explain a biological reason for the difference in their late growth patterns. [2 marks]
Practice marking scheme
Answer
a) P: exponential; Q: logistic. b) Approximately 500 individuals. c) Density-dependent resource limitation slows Q; P has not encountered such a limit over the interval shown.
Working
P has a J-shaped trajectory with increasing population increments. Q has an S-shaped trajectory that levels near 500. Increasing density can intensify competition for food, space or other resources, reducing births or increasing deaths so that net growth slows near carrying capacity.
Marking criteria
- Identifies P as exponential. [1 mark]
- Identifies Q as logistic. [1 mark]
- Estimates carrying capacity near 500. [1 mark]
- Identifies an appropriate density-dependent limiting factor. [1 mark]
- Links it to reduced net growth of Q at high density. [1 mark]
Practice question aligned to the current QCAA syllabus; review the worked solution and marking criteria.
View the QCAA syllabusCompare your working with the guide above.