QUESTION 36 (5 marks)
The graph shows the mean number of seedlings per 1 m² quadrat at locations along a dune transect. Soil salinity decreases with increasing distance from the shore.
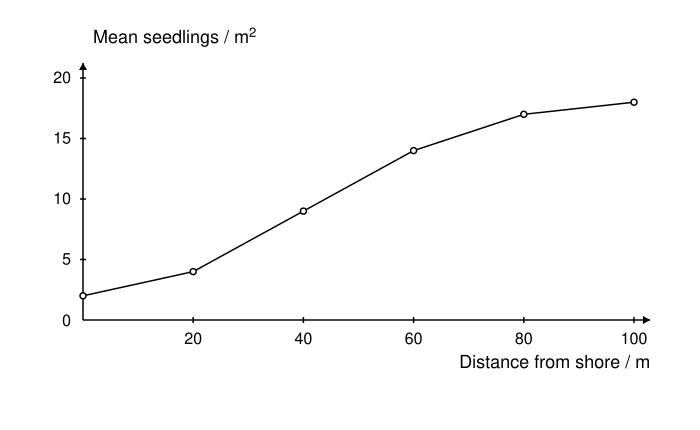
a) Describe the trend in seedling abundance, including numerical evidence. [2 marks]
b) Explain why the data alone cannot show that salinity caused the trend. [2 marks]
c) Identify an additional abiotic measurement that could help interpret the pattern. [1 marks]
Practice marking scheme
Answer
a) Seedling abundance increases from 2 to 18 per m² between 0 and 100 m. b) This is an association; other factors may also change along the transect. c) For example, soil moisture.
Working
Abundance increases overall as distance increases and salinity decreases. Other conditions, such as soil moisture, nutrient concentration, wind exposure and competition, may vary with distance. Without separating these effects, the data do not establish salinity as the sole cause. Measuring another abiotic factor or using a controlled manipulation could distinguish explanations.
Marking criteria
- Identifies increasing seedling abundance with distance. [1 mark]
- Supports the trend with correct numerical values. [1 mark]
- Recognises that correlation does not establish causation. [1 mark]
- Identifies a plausible confounding factor or absence of experimental control. [1 mark]
- Identifies a relevant additional abiotic measurement. [1 mark]
Practice question aligned to the current QCAA syllabus; review the worked solution and marking criteria.
View the QCAA syllabusCompare your working with the guide above.