QUESTION 59 (5 marks)
Two equal-area farm plots are surveyed using the same method. Plot M is a monoculture; plot D contains several crop species. The table summarises their arthropod communities.
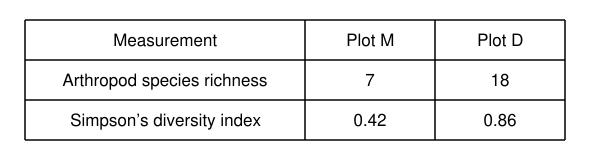
a) Compare the arthropod communities using richness and SDI. [2 marks]
b) Suggest a biological explanation for greater diversity in D. [2 marks]
c) Identify why these two plots alone do not establish a general effect of crop diversity. [1 marks]
Practice marking scheme
Answer
a) D has greater richness and higher SDI. b) Several crops can provide a wider range of food and microhabitats. c) There is no replication of each plot type, and other plot differences may confound the comparison.
Working
D contains 18 species compared with 7, and its SDI is 0.86 rather than 0.42. Different crop species may provide different resources or structural habitats, allowing more niches and reducing dominance by a few arthropods. One plot of each type cannot separate crop-diversity effects from other site differences; replicated comparable plots would strengthen inference.
Marking criteria
- Compares richness correctly. [1 mark]
- Compares SDI correctly. [1 mark]
- Identifies a greater range of resources or microhabitats in D. [1 mark]
- Links this to more niches/coexisting species. [1 mark]
- Identifies lack of replication or an appropriate confounding limitation. [1 mark]
Practice question aligned to the current QCAA syllabus; review the worked solution and marking criteria.
View the QCAA syllabusCompare your working with the guide above.