Organic analysis practice
QCE Chemistry · Original practice questions with worked solutions
Practise combining mass spectra, infrared spectra and chemical tests. Use each observation as a constraint on possible structures.
Key ideas
- Where present, the molecular-ion peak helps identify molecular mass. Fragment peaks add structural evidence.
- Infrared absorption bands can support the presence of particular bonds or functional groups; use the supplied data.
- Combine all evidence and check the final candidate against the molecular formula, functional groups and test results.
Worked example
A strong carbonyl band supports a group. A broad acid O–H band provides additional evidence for a carboxylic acid rather than a ketone.
A common mistake
One spectral peak usually cannot uniquely identify a molecule. Check that the complete evidence fits.
Try these questions
Attempt each question before revealing the worked solution. Saved questions and checked answers also appear in the main bank on this device. Exam marks are recorded after marking a practice exam.
Q26 · Practice questionSimple familiar1 mark
An amino-acid spot travels 3.6 cm while the solvent front travels 6.0 cm from the baseline. Its is
(A)
0.40
(B)
0.60
(C)
1.67
(D)
2.40
ANSWER
B
.
Select B.
Q75 · Practice questionComplex familiar4 marks
QUESTION 75 (4 marks)
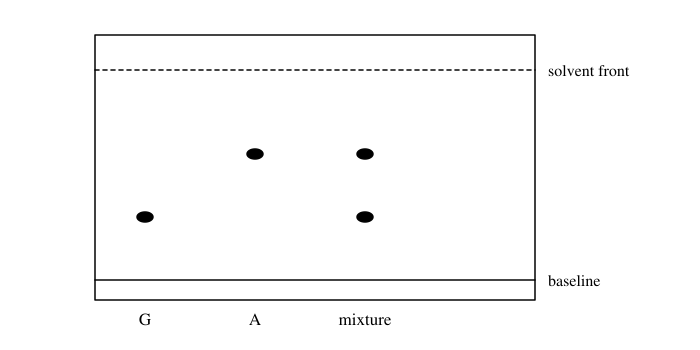
A TLC plate compares amino-acid standards G and A with a mixture. The solvent front travels 8.0 cm. The lower and upper spots travel 2.4 cm and 4.8 cm respectively. Standards and mixture are run under identical conditions.![Chemistry question figure. Context: a) Calculate the two retention factors. [2 marks]. Visible labels: Thin-layer chromatogram with labelled baseline and solvent front; solventfront; baseline; GAmixture](/question-assets/chemistry/assets/original/q075-amino-acid-tlc.svg)
a) Calculate the two retention factors. [2 marks]
b) Infer the mixture components and state one limitation of this inference. [2 marks]
ANSWER
Rf values 0.30 and 0.60; the mixture is consistent with containing G and A, but identical Rf does not prove identity.
Divide each spot distance by 8.0 cm. The mixture spots align with the standards. Other amino acids may share the same retention factor in this solvent, so an additional solvent or analytical method could be needed.
Calculates 0.30.
Calculates 0.60.
Infers G and A consistently with the standards.
States co-migration does not uniquely identify a compound.
Q76 · Practice questionSimple familiar4 marks
QUESTION 76 (4 marks)
ANSWER
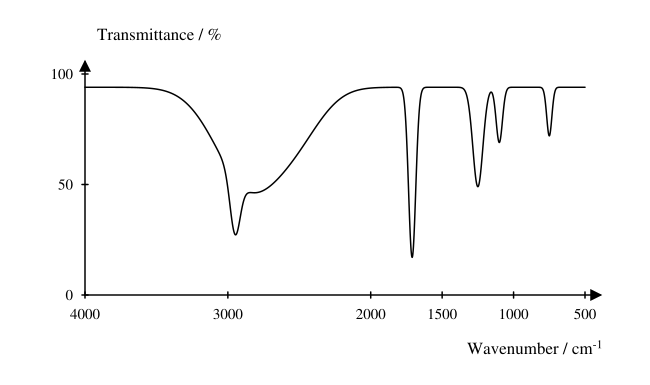
Carboxylic acid; a strong C=O absorption near 1700 cm⁻¹ and a very broad O–H band extending through approximately 2500–3300 cm⁻¹. IR does not alone establish the complete carbon skeleton.
The combination of a carbonyl and the exceptionally broad acid O–H distinguishes a carboxylic acid from the other listed classes. Several acids may share these functional groups.
Identifies carboxylic acid.
Cites strong carbonyl absorption.
Cites broad acid O–H absorption.
Explains functional-group evidence is not a unique whole-molecule identification.
All organic analysis practice questions
16 original questions · Page 1 of 1
- Q26 · Original practice · 1 markOrganic analysisAn amino-acid spot travels 3.6 cm while the solvent front travels 6.0 cm from the baseline. Its is
- Q27 · Original practice · 1 markOrganic analysisAn amino acid with isoelectric point 6.0 undergoes electrophoresis at pH 3.0. Its net charge and direction of migration are
- Q28 · Original practice · 1 markOrganic analysisA compound has a strong IR absorption near 1715 cm⁻¹ but no broad O–H absorption. Which class is consistent with this evidence?
- Q75 · Original practice · 4 marksOrganic analysisA TLC plate compares amino-acid standards G and A with a mixture. The solvent front travels 8.0 cm. The lower and upper spots travel 2.4 cm and 4.8 cm respectively. Standards and mixture are run under identical conditions.
- Q76 · Original practice · 4 marksOrganic analysisThe illustrative IR spectrum belongs to one of these compound classes: alkane, alcohol, ketone or carboxylic acid.
- Q77 · Original practice · 4 marksOrganic analysisA spectrum has a molecular ion at and a base peak at . The two candidates are propanal and propanone. The 43 fragment is assigned as .
- Q78 · Original practice · 5 marksOrganic analysisA compound contains 54.5% C, 9.1% H and 36.4% O by mass. Its molecular-ion peak is at (singly charged). The IR spectrum has a strong carbonyl band and a broad acid O–H band. Use C = 12.0, H = 1.0, O = 16.0.
- Q79 · Original practice · 4 marksOrganic analysisA purified amino acid with isoelectric point 5.8 is placed at the origin of the electrophoresis apparatus. The buffer has pH 8.0.
- Q88 · Original practice · 7 marksOrganic analysisA pure monoprotic carboxylic acid contains 40.0% C, 6.67% H and 53.3% O by mass. A 0.360 g sample is made up to 250.0 mL; a 25.00 mL aliquot requires 12.00 mL of 0.05000 mol L⁻¹ NaOH. The undiluted 250.0 mL acid solution has pH 3.19. Use C = 12.0, H = 1.0, O = 16.0.
- Q96 · Original practice · 7 marksOrganic analysisTwo amino-acid standards have these properties: glutamic acid, and pI = 3.2; arginine, and pI = 10.8. A mixture on the same TLC plate gives spots 2.0 cm and 5.2 cm from a baseline; the solvent front travels 8.0 cm. A separate portion undergoes electrophoresis at pH 6.0.
- Q98 · Original practice · 6 marksOrganic analysisAn unknown acyclic carbonyl compound is either butanal or butan-2-one. It has molecular-ion mass 72 and no broad O–H IR band. Heated acidified dichromate changes orange to green. Oxidation of 0.360 g of the unknown gives 0.400 g of the corresponding carboxylic acid. Use molar masses: unknown 72.1 g mol⁻¹; acid 88.1 g mol⁻¹.
- Q115 · Original practice · 1 markOrganic analysisAmino acid X migrates towards the negative electrode at pH 4.0 and towards the positive electrode at pH 8.0. Which isoelectric point is consistent with both observations?
- Q116 · Original practice · 1 markOrganic analysisAn amino-acid sample produces one spot on a TLC plate. Which conclusion is justified?
- Q152 · Original practice · 5 marksOrganic analysisThree amino acids are placed at the origin in separate lanes for electrophoresis in a buffer of pH 6.0. The positive electrode is on the left and the negative electrode is on the right. Use the pI values in the table. Ignore bulk movement of the buffer.
- Q153 · Original practice · 5 marksOrganic analysisAn amino-acid mixture is compared with three standards by TLC in two different solvent systems. In system 1 the solvent front travels 8.0 cm; the mixture has spots at 2.4 cm and 5.6 cm. In system 2 the mixture has Rf values 0.50 and 0.60. All standard comparisons are made under the same conditions within each solvent system.
- Q154 · Original practice · 4 marksOrganic analysisThe simplified mass spectrum is from one of these compounds: ethanol, ethane, chloroethane or 1-chloropropane. Its molecular-ion pair is at m/z = 64 and 66. Chlorine has isotopes with masses 35 and 37 in an approximate 3:1 abundance ratio. Use C = 12, H = 1 and O = 16. The infrared spectrum has no O–H absorption.