QCEVault

Sampling and proportions — Question 193

Original QCE Vault practice · 3 marks

Q193 · Practice questionTechnology-activeSimple familiar3 marks

QUESTION 193 (3 marks)

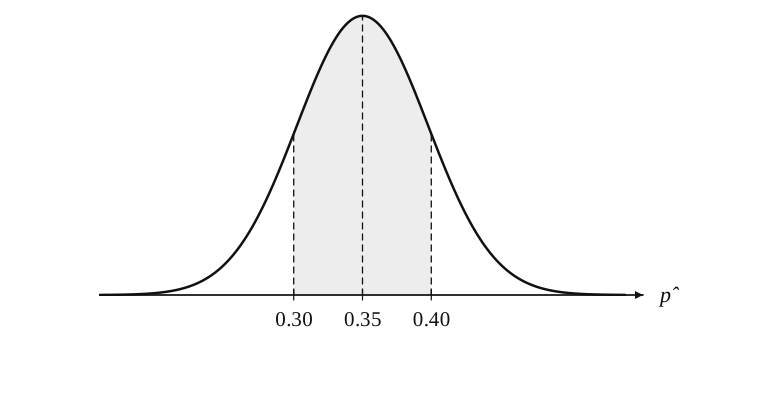
A population proportion is p=0.35p=0.35. For random samples of size 100100, the sampling distribution of p^\hat p is approximated by the normal curve shown. Determine its mean and standard deviation, and estimate P(0.30<p^<0.40)P(0.30<\hat p<0.40).
Approximate normal sampling distribution for sample proportion centred at 0.35 with the region from 0.30 to 0.40 shaded.
Question link

Related questions

  1. Q3 · 2025 QCAA · Paper 1 · 1 mark
    A council wants to survey residents about a new dog park. Which sampling method would best minimise bias in the survey?
    Sampling and proportions
  2. Q5 · 2025 QCAA · Paper 1 · 1 mark
    A box contains 100 balls, each of which is either green, blue or red. A teacher asks students to select a ball at random, record its colour and return it to the box. This process is repeated until each student has selected and recorded the colours of a sample of balls. Each student chooses their own sample size. The sample size, nn, and sample proportion of…
    Sampling and proportions
  3. Q7 · 2024 QCAA · Paper 1 · 1 mark
    Twenty families are selected to participate in a lifestyle study related to family size. The number of children in these families is uniformly distributed as shown.
    A random sample of five families is chosen from this group, without replacement. A possible mean number of children in the sample is
    Sampling and proportions
  4. Q14 · 2024 QCAA · Paper 1 · 5 marks
    At a particular game at a local sporting venue, 60% of spectators support the home team and the remainder support the away team. A researcher asked six groups of 10 spectators which team they supported. Each spectator was recorded as either H (supports home team) or A (supports away team). The results were:
    Group 1: H A H H H A H H H H Group 2: A A H A A H…
    Sampling and proportions