QCEVault

Sampling and proportions — Question 7

QCAA 2024, Paper 1 · 1 mark

Q7 · 2024 · Technology-freeSimple familiar1 mark

QUESTION 7

Twenty families are selected to participate in a lifestyle study related to family size. The number of children in these families is uniformly distributed as shown.
A random sample of five families is chosen from this group, without replacement. A possible mean number of children in the sample is
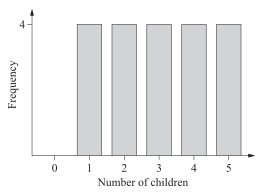
Uniform frequency graph showing four families for each family size from one to five children
(A)
5.0
(B)
2.0
(C)
1.0
(D)
0.0
Question linkOriginal paper

Related questions

  1. Q3 · 2025 QCAA · Paper 1 · 1 mark
    A council wants to survey residents about a new dog park. Which sampling method would best minimise bias in the survey?
    Sampling and proportions
  2. Q5 · 2025 QCAA · Paper 1 · 1 mark
    A box contains 100 balls, each of which is either green, blue or red. A teacher asks students to select a ball at random, record its colour and return it to the box. This process is repeated until each student has selected and recorded the colours of a sample of balls. Each student chooses their own sample size. The sample size, nn, and sample proportion of…
    Sampling and proportions
  3. Q14 · 2024 QCAA · Paper 1 · 5 marks
    At a particular game at a local sporting venue, 60% of spectators support the home team and the remainder support the away team. A researcher asked six groups of 10 spectators which team they supported. Each spectator was recorded as either H (supports home team) or A (supports away team). The results were:
    Group 1: H A H H H A H H H H Group 2: A A H A A H…
    Sampling and proportions
  4. Q7 · 2023 QCAA · Paper 2 · 1 mark
    The sampling distribution of a sample proportion has mean 0.700.70 and standard deviation 0.020.02. The sample size is
    Sampling and proportions