Q14 · 2024 · Technology-freeSimple familiar5 marks
QUESTION 14 (5 marks)
At a particular game at a local sporting venue, 60% of spectators support the home team and the remainder support the away team.
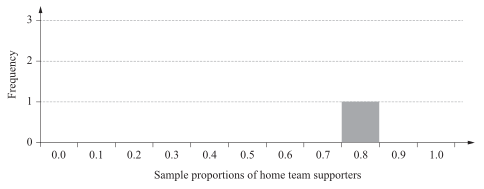
A researcher asked six groups of 10 spectators which team they supported. Each spectator was recorded as either H (supports home team) or A (supports away team). The results were:
Group 1: H A H H H A H H H H
Group 2: A A H A A H A A A A
Group 3: H A A H H A A A H H
Group 4: H H H H H A H H H H
Group 5: A A H H A H H A H A
Group 6: A H A A A A A H A A
a)[3 marks]
The researcher would like to see the distribution of the sample proportions of home team supporters obtained by entering the information into a column graph. The sample proportion for group 1 is shown. Complete the column graph by including the sample proportions for the remaining five groups.
Note: If you make a mistake in the diagram, cancel it by ruling a single diagonal line through your work and use the additional response space at the back of this question and response book.
b)[2 marks]
If the researcher had interviewed more groups, each containing 100 spectators, describe two ways the distribution of the resulting sample proportions would be expected to differ from the distribution shown in Question 14a).
WORKED SOLUTION
5 marksQCAA guide · typeset solution
ANSWER
a) has frequency 2, has frequency 2, and has frequency 1. b) The distribution would be more symmetrical about 0.6 and would have less variability (a narrower spread).
Worked solution
a) Sample proportion : frequency . Sample proportion : frequency . Sample proportion : frequency .
b) For larger samples, the distribution of would be expected to become more symmetrical about the population proportion of . There would also be less variability about the mean of , so the graph would appear narrower, with fewer high or low sample proportions.
correctly sketches the sample proportion 0.2
correctly sketches the sample proportion 0.5
correctly sketches the sample proportion 0.9
correctly identifies one change to the distribution of as it more closely approximates normality due to the larger samples — a more symmetrical graph
correctly identifies a second change to the distribution of as it more closely approximates normality due to the larger samples — there would be less variability and the appearance of the graph would look narrower or “skinnier”
One QCAA sample method typeset for web; criterion wording is adapted from the official marking guide.
View the full QCAA marking guideHow many marks did you earn?
Compare your working with the guide above.