Q11 · Practice questionSimple familiar1 mark
QUESTION 11
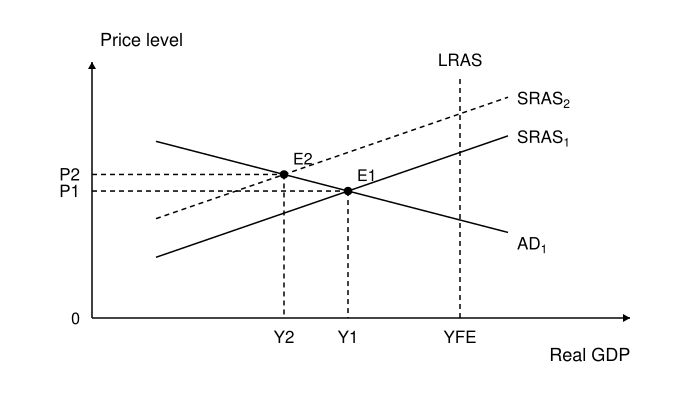
The diagram shows a change from E1 to E2. A likely cause is
(A)
a fall in income tax that stimulates consumption.
(B)
an increase in labour productivity.
(C)
a decline in household spending.
(D)
a disruption that raises businesses’ transport costs.
WORKED SOLUTION
1 markAnswer D
Answer
D
Working
A negative supply shock shifts SRAS left/up. The model shows lower real GDP and a higher price level, consistent with increased production costs.
Marking criteria
- Select D. [1 mark]
Practice question aligned to the current QCAA syllabus; review the worked solution and marking criteria.
View the QCAA syllabus