QUESTION 9 (7 marks)
The graphs show the findings of an experiment investigating the competitive exclusion principle. Two species of protozoa (P. aurelia and P. caudatum) were grown separately and together under identical conditions.
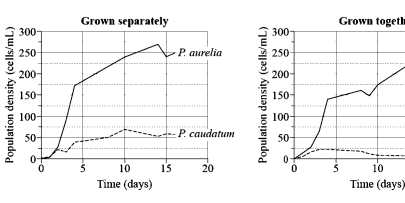
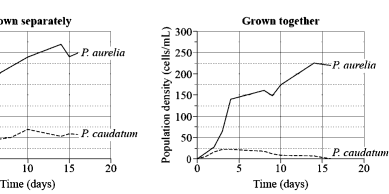
a) Identify the population density of P caudatum on day 10 when grown separately. [1 mark]
b) Compare the growth of P. aurelia in the two graphs. [3 marks]
c) Use the data to explain the competitive exclusion principle.
QCAA guide · typeset solution
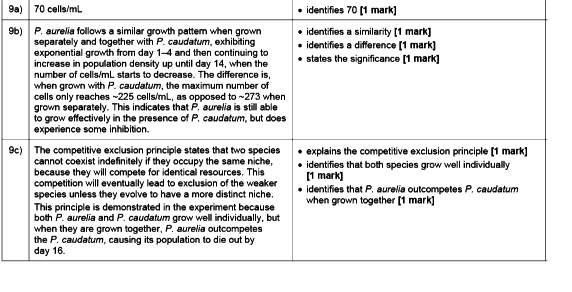
QCAA sample response and mark allocation
© State of Queensland (QCAA) 2023 ttps://creativecommons.org/licenses/by/4.0 | Copyright notice: www.qcaa.qld.edu.au/copyright — lists the full terms tions, which specify certain exceptions to the licence. | Attribution: © State of Queensland (QCAA) 2023
QCAA sample response and marking criteria reproduced from the official guide.
Compare your working with the guide above.