Q8 · 2022 · Paper 1Unclassified1 mark
QUESTION 8
The graph shows how the populations of two species in an ecosystem change over time.
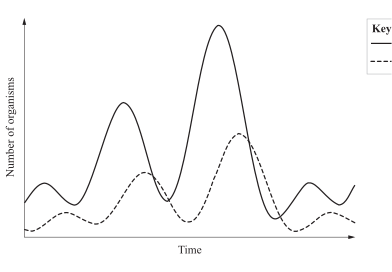
Species X Species Y
Which species interaction is represented?
(A) predation, where species X preys on species Y
(B) predation, where species Y preys on species X
(C) competition, where species X outcompetes species Y
(D) competition, where species Y outcompetes species X
WORKED SOLUTION
1 markAnswer B
OFFICIAL ANSWERB
QCAA awards 1 mark for selecting option B.
Correct option from the official QCAA answer key.