Q5 · 2021 · Paper 1Unclassified1 mark
QUESTION 5
The graph shows changes for a penguin population and the theoretical carrying capacity of the environment.
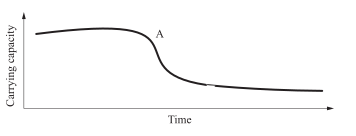
Point A on the graph indicates a change in carrying capacity triggered by
(A) an increase in penguin pathogens.
(B) a decrease in the number of mates available.
(C) a reduction in space available for nesting sites.
(D) an introduced disease affecting the penguins’ survival rates.
WORKED SOLUTION
1 markAnswer C
OFFICIAL ANSWERC
QCAA awards 1 mark for selecting option C.
Correct option from the official QCAA answer key.