QUESTION 25 (4 marks)
The following simplified energy-flow diagram provides the gross productivity figures for producers and herbivores in an ecosystem.
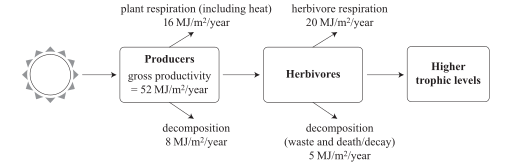
a) Determine the net productivity for the producers and herbivores in this ecosystem.
[2 marks]
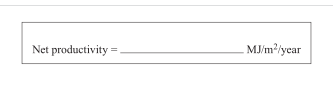
Producers:
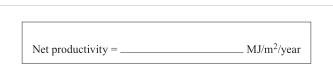
Herbivores:
b) Contrast the outputs of energy for the two trophic levels in the diagram.
[2 marks]
QCAA guide · typeset solution
QCAA sample response and mark allocation
25 | a) | • states 36 MJ/m2/year for producers [1 mark] • states 3 MJ/m2/year for herbivores [1 mark] | Allow FT error for herbivores. | |
25 | b) | Respiration was higher for the herbivores. Decomposition was higher for the producers. | • identifies 1 relevant difference between respiration and decomposition [1 mark] • identifies another relevant difference between respiration and decomposition [1 mark] OR • determines % loss at each trophic level • identifies % loss is higher for herbivores than autotrophs [1 mark] | Differences may include any: difference in respiration (4 MJ) difference in decomposition (3 MJ) identification of respiration being higher for herbivores or other suitable response consistent with a reasonable understanding. |
QCAA sample response and marking criteria reproduced from the official guide.
Compare your working with the guide above.