Q12 · 2023 · Technology-activeSimple familiar4 marks
QUESTION 12 (4 marks)
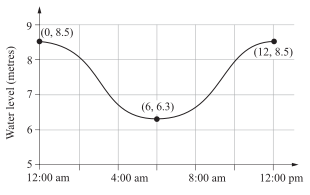
The graph shows the water level under a bridge over a 12-hour period.
a)[1 mark]
Determine the equation of the cosine function that models the water level as a function of time after 12:00 am.
b)[3 marks]
How long in the 12-hour period shown is the rate of change of water level more than 0.55 metres per hour?
WORKED SOLUTION
4 marksQCAA guide · typeset solution
ANSWER
a) ; b) approximately 69 minutes.
Worked solution
a) The graph is cosine with a period of 12, amplitude 1.1 and equilibrium height 7.4 with no phase shift. Therefore
b) Using GDC and solving , the interval where the rate of change is more than metres per hour is . Thus the duration is hours, i.e.
correctly determines the equation of the graph
determines the derivative equation
determines time interval where rate of change is more than 0.55 metres per hour
determines the time interval
One QCAA sample method typeset for web; criterion wording is adapted from the official marking guide.
View the full QCAA marking guideHow many marks did you earn?
Compare your working with the guide above.