Q5 · 2021 · Technology-freeSimple familiar1 mark
QUESTION 5
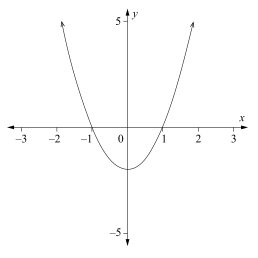
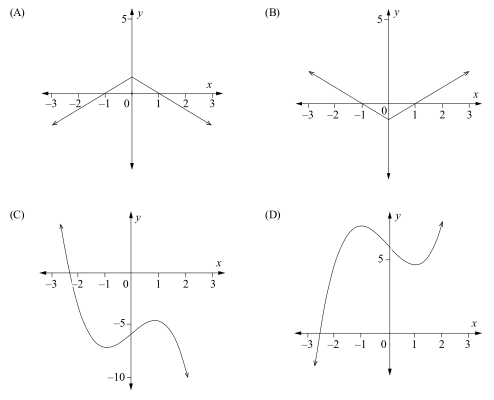
The graph of is shown. Which of the following could be the graph of ?
WORKED SOLUTION
1 markAnswer D
ANSWER
D
Worked solution
The shown is positive for and , and negative for . Hence increases, then decreases, then increases, giving a local maximum near and a local minimum near . Only option D has this behaviour.
Selects option D.
Worked explanation by QCE Vault; correct option verified against the QCAA answer key.
View the full QCAA marking guide