Q16 · 2020 · Technology-freeSimple familiar4 marks
QUESTION 16 (4 marks)
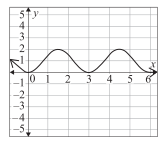
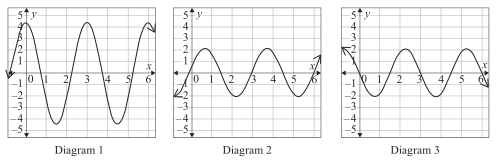
Consider the graph of shown. Identify the graph of the second derivative from the graphs in Diagram 1, Diagram 2 and Diagram 3. Justify your decisions using mathematical reasoning.
WORKED SOLUTION
4 marksQCAA guide · typeset solution
ANSWER
Diagram 1
Worked solution
changes concavity at certain points and is increasing and decreasing between and , and between and . Therefore the sketch of must be positive and negative over these intervals. has maximum and minimum points at approximately and , so crosses the -axis at these points. Diagram 1 is .
correctly identifies an appropriate method to determine the graph
correctly determines a relevant feature of the graph of
correctly determines a relevant feature for
correctly identifies Diagram 1
One QCAA sample method typeset for web; criterion wording is adapted from the official marking guide.
View the full QCAA marking guideHow many marks did you earn?
Compare your working with the guide above.