QUESTION 11 (8 marks)
Country A is dependent on oil exports. Their major oil destination country has discovered an environmentally sustainable substitute for oil. Explain and illustrate the effect on Country A using two different economic models.
QCAA guide · typeset solution
QCAA sample response and mark allocation
Section 2: Short response
Q | The response: | Notes | ||
11 | For one model (4 marks) | |||
• draws an accurate diagram [1 mark] • includes an accurate title, axis labels and relevant notations [1 mark] • describes a clear movement before and after change, using correct terms and refers to diagram [1 mark] • accurately explains the change resulting from the oil substitute discovery [1 mark] | ||||
For a second model (4 marks) | ||||
• draws an accurate diagram [1 mark] • includes an accurate title, axis labels and relevant notations [1 mark] • describes a clear movement before and after change, using correct terms and refers to diagram [1 mark] • accurately explains the change resulting from the oil substitute discovery [1 mark] | ||||
Sample response 1 | ||||
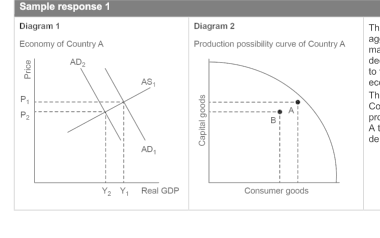
The aggregate demand / aggregate supply diagram shows the decrease in aggregate demand since demand for oil has fallen because international markets substitute Country A’s oil for the cheaper alternative. This causes a decrease in demand from AD1 to AD2, causing the price of oil and quantity sold to fall to a lower equilibrium (P2Y2). The likely consequence is a slowing of the economy’s use of resources. The production possibility curve shows the maximum production possible for Country A, given its existing resources. With less oil being demanded and produced, their oil resources are underutilised, shown by a movement from point A to B. This fall in the employment of resources would be reflected in decreased demand and lower GDP. | ||||
Sample response 2 | ||
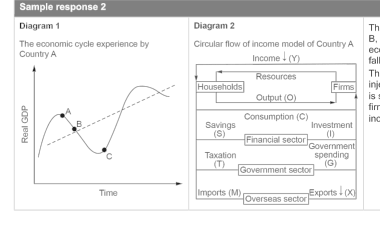
The economic cycle diagram shows a slowing of economic activity (point A to B, or B towards C), due to falling economic growth. The cause of the slowing economy is the falling oil export revenues received by Country A. This significant fall in injections is because Country A is dependent on oil exports. The circular flow of income of Country A would be less, as there are less injections of export income due to their major oil client demanding less oil. This is shown as ↓ X on the diagram, which would lead to less production of oil by firms and less employment within the oil industry. The flow-on effect is lower incomes in the Household sector ↓ Y. | ||
QCAA sample response and marking criteria reproduced from the official guide.
Compare your working with the guide above.