QUESTION 5 (9 marks)
A student investigating the health of two freshwater ecosystems collected the data shown.
Abiotic indicator | Healthy range |
Dissolved oxygen (% saturation) | 90–110 |
Turbidity (NTU) | 1–20 |
pH | 6.5–8.0 |
Ecosystem 1 | Ecosystem 2 | ||
Abiotic data | Dissolved oxygen (% saturation) | 95 | 105 |
Turbidity (NTU) | 20 | 5 | |
pH | 6.2 | 7.5 | |
Biotic data | Species richness | 13 | 12 |
Simpson’s diversity index (SDI) | 0.38 | 0.82 |
a) Infer which ecosystem has the greatest species evenness. Explain your reasoning.
[2 marks]
b) Use the abiotic data to compare the health of the two ecosystems.
[3 marks]
Similarity:
Difference:
Significance:
The chart shows pH tolerance ranges for phytoplankton species observed in the investigation.
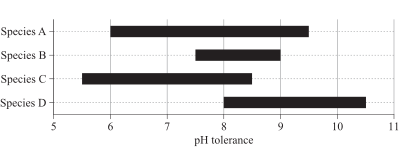
c) Identify the species with the greatest pH tolerance range and state the tolerance range.
[2 marks]
d) Determine which two species were most likely observed in ecosystem 1.
[1 mark]
e) Determine the probability that two randomly caught individuals from ecosystem 2 were from the same species.
[1 mark]
QCAA guide · typeset solution
QCAA sample response and mark allocation
5a) | The biotic data suggests that ecosystem 2 has the greatest species evenness. Species richness is similar for both ecosystems, but SDI is much higher in ecosystem 2 (0.82 vs 0.38). Because SDI considers both richness and evenness, it can be inferred that the higher SDI is due to greater evenness. | • infers ecosystem 2 [1 mark] • provides appropriate reasoning [1 mark] |
5b) | Similarity: Both ecosystems are within the healthy range for dissolved oxygen and turbidity. Difference: Only ecosystem 2 is in the healthy range for pH. Significance: This suggests that ecosystem 2 is healthier than ecosystem 1. | • identifies a similarity [1 mark] • identifies a difference [1 mark] • identifies the significance [1 mark] |
5c) | Species A. Tolerance range: pH 6–9.5 | • identifies species A [1 mark] • states the tolerance range [1 mark] |
5d) | Species A and C | • determines species A and C [1 mark] |
5e) | 1 – 0.82 = 0.18 18% chance | • determines 18% [1 mark] |

QCAA sample response and marking criteria reproduced from the official guide.
Compare your working with the guide above.