QUESTION 3 (6 marks)
Students used 10 quadrats, each 1 m2 in size, to investigate the number of ant nests in a 100 m2 section of their school oval. A random number generator was used to determine the location of each quadrat. Results
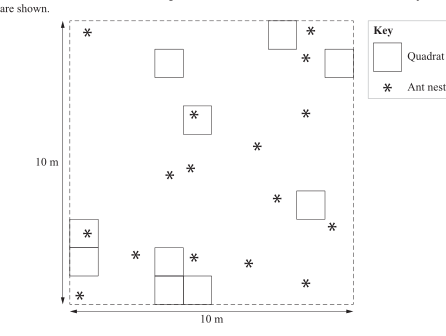
a) Use the quadrat data to predict the number of ant nests in the 100 m2 section of the oval. Show your working.
[2 marks]
b) Contrast the actual number of ant nests with that predicted by the quadrat data.
[2 marks]
c) Explain why the students did not use stratified sampling for this investigation.
[2 marks]
QCAA guide · typeset solution
QCAA sample response and mark allocation
3a) | ==×=22number of ant nestsAnt nest densityarea sampled2 nests(101 m )0.2 nestsm220.2 nests×100mPredicted number of ant nests =m | • provides appropriate working [1 mark] |
• predicts 20 ant nests [1 mark] | ||
3b) | Predicted nests: 20; actual nests: 16 | • identifies actual number of nests [1 mark] |
×=4100%25%16The predicted number of ant nests was 25% greater than the actual number of nests. | • contrasts predicted and actual values [1 mark] | |
3c) | Stratified sampling is used in situations where distinct strata exist that may affect the distribution of species. There is no indication that distinct strata exist in this scenario. | • recognises the purpose of stratified sampling [1 mark] • explains the area does not have distinct strata [1 mark] |

QCAA sample response and marking criteria reproduced from the official guide.
Compare your working with the guide above.