QUESTION 21 (7 marks)
In 2014, a group of scientists surveyed a plant community and determined Simpson’s diversity index (SDI) to be 0.84. They returned to the same site in 2024 and collected this data.
Species | Number of individuals |
A | 133 |
B | 96 |
C | 256 |

[2 marks]
b) The scientists noted that species richness was the same in 2024 and 2014. Infer how species evenness changed over the 10-year period. Justify your response.
[2 marks]
c) Describe how sampling could be used to collect data for this investigation. Include at least two strategies to minimise bias.
[3 marks]
QCAA guide · typeset solution
QCAA sample response and mark allocation
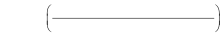
21a) | (133 132)(96 95)(256255)1485 4840.61SDI×+×+×= −×= | • determines SDI as 0.61 [1 mark] • provides appropriate working [1 mark] |
21b) | Species evenness decreased over the 10-year period. SDI considers both species richness and evenness — the greater the species richness and evenness, the higher the SDI value. As species richness was the same in both years but SDI decreased from 0.84 to 0.61, it can be inferred that species evenness was lower in 2024 than in 2014. | • infers that species evenness decreased over the 10-year period [1 mark] • justifies inference using SDI data [1 mark] |
21c) | Quadrats could be randomly placed throughout the forest, and the number and type of plants observed in each quadrat recorded. This data could then be pooled and used to estimate the total number of each plant species at the site. The researchers could ensure that at least 10% of the site is sampled (by considering number and size of quadrats) and use a random- number generator to decide where to place the quadrats. | • describes an appropriate surveying technique [1 mark] • identifies one strategy to minimise bias [1 mark] • identifies a second strategy to minimise bias [1 mark] |
QCAA sample response and marking criteria reproduced from the official guide.
Compare your working with the guide above.