QUESTION 7 (6 marks)
The graph shows the population of bacteria in a Petri dish over time.
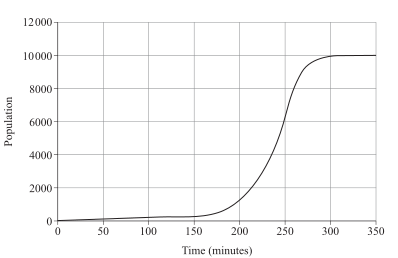
a) Identify the mode of population growth.
[1 mark]
b) Determine the carrying capacity under these conditions.
[1 mark]
Conditions were modified at 380 minutes and the population continued to be monitored. Results are shown.
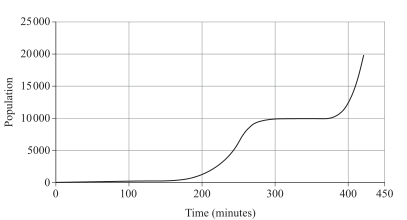
c) Identify two modifications that could cause this change. Explain your reasoning.
[4 marks]
QCAA guide · typeset solution
QCAA sample response and mark allocation
7a) | Logistic growth. | • identifies logistic growth [1 mark] |
7b) | 10 000. | • determines the carrying capacity is 10 000 [1 mark] |
7c) | More nutrients added to the Petri dish: an increase in food availability would allow a larger population to obtain vital nutrients, therefore increasing the carrying capacity. Increasing the size of the Petri dish: This would increase the available space, so more organisms can survive and be in contact with the nutrient agar. | • identifies one modification that could cause the change [1 mark] • explains how the first modification increases carrying capacity [1 mark] • identifies a second modification that could cause the change [1 mark] • explains how the second modification increases carrying capacity [1 mark] |
QCAA sample response and marking criteria reproduced from the official guide.
Compare your working with the guide above.