QUESTION 12 (5 marks)
An investigation compared mangrove species diversity for two areas of different size in the same catchment. The table shows species population counts for each area.
Area 1 | Area 2 | ||
Total species count | Grey mangrove | 37 | 7 |
Red mangrove | 32 | 3 | |
Yellow mangrove | 25 | 88 | |
SDI | 0.67 | ? | |

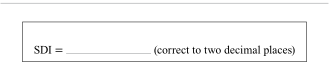
a) Calculate Simpson’s diversity index for Area 2. Show your working.
[2 marks]
b) Using your answer for Question 12a), compare the diversity of the two areas.
[3 marks]
QCAA guide · typeset solution
QCAA sample response and mark allocation
12a) | SDI = 1 −(7(7−1)+3(3−1)+88(88−1)98(98−1)) = 0.19 | |
12b) | Area 2 has lower SDI than Area 1. While the communities’ total populations are similar (94 to 98), Area 2 has a species that is dominant (Yellow mangroves) which causes the SDI in Area 2 to be much lower than Area 1. | • states a relevant similarity [1 mark] • states a relevant difference [1 mark] • states the significance of the identified differences [1 mark] |

QCAA sample response and marking criteria reproduced from the official guide.
Compare your working with the guide above.