Q28 · 2021 · Paper 1Unclassified3 marks
QUESTION 28 (3 marks)
The graph depicts the population change of a species after it is introduced into a previously disturbed environment.
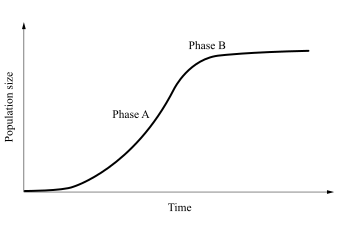
Referring to Phase A and Phase B, determine the population growth model for the species.
WORKED SOLUTION
3 marksQCAA guide · typeset solution
QCAA sample response and mark allocation
28 | Phase A: Population is low and resources are plentiful; maximum growth rate is observed; births consistently outnumber deaths. Phase B: Birth and death rates become balanced as population reaches carrying capacity. | • refers to a feature of - Phase A [1 mark] - Phase B [1 mark] - determines population growth model as logistic [1 mark] |
Population growth model: logistic |
QCAA sample response and marking criteria reproduced from the official guide.
How many marks did you earn?
Compare your working with the guide above.