QCEVault

Statistical inference — Question 10

QCAA 2023, Paper 1 · 1 mark

Q10 · 2023 · Technology-freeSimple familiar1 mark

QUESTION 10

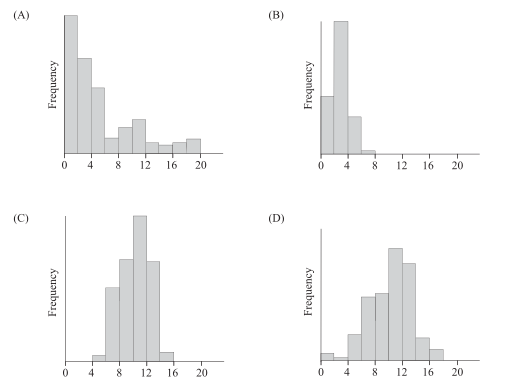
A random variable is drawn from a population with the distribution shown in the histogram. A number of samples of size 10 were randomly selected from this distribution and the sample means, xˉ\bar x, were recorded. The histogram that most likely represents the distribution of the sample means is
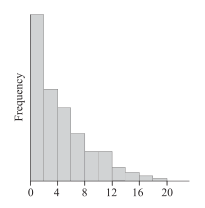
Histogram of the population distribution used in Question 10.
Four candidate histograms A to D for the distribution of the sample means.
Question linkOriginal paper

Related questions

  1. Q4 · 2025 QCAA · Paper 1 · 1 mark
    XX is a random variable with mean μ\mu and standard deviation σ\sigma. From random samples of XX values, each of size nn, the sample mean is calculated. This sampling and calculation is repeated a large number of times. The mean of the distribution of the sample means would be approximately
    Statistical inference
  2. Q9 · 2025 QCAA · Paper 1 · 1 mark
    An approximate confidence interval for a population mean is calculated based on a sample size of 16 and is found to have width, ww. A second confidence interval is calculated from another sample with the same sample standard deviation. Given that the same zz-value was used for both intervals and the width of the second interval is 2w2w, what is the size of…
    Statistical inference
  3. Q14 · 2025 QCAA · Paper 1 · 5 marks
    A factory produces cans of juice. Each can has a labelled volume of 500 mL.
    The factory manager conducted a random sample of 100 cans to assess whether the labelled volume was being met satisfactorily in production. The mean volume of the sample was 498.9 mL with a sample standard deviation of 4.0 mL.
    Statistical inference
  4. Q5 · 2025 QCAA · Paper 2 · 1 mark
    The height (cm) of people in a certain population is normally distributed with a standard deviation of 7.427.42 cm.
    A researcher takes repeated random samples of 1515 people and calculates the mean height for each sample.
    The expected standard deviation (cm) of the distribution of these sample mean heights would be approximately
    Statistical inference