Q10 · 2021 · Technology-freeSimple familiar1 mark
QUESTION 10
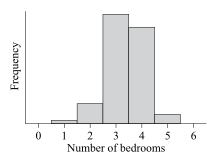
The 2016 Australian census recorded the number of bedrooms per household. The results are summarised in the histogram, as shown. Based on this data, the mean number of bedrooms per household was calculated to be .
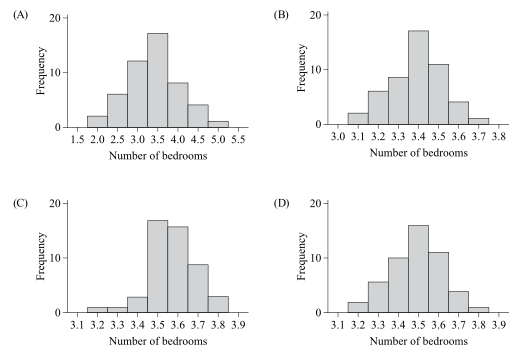
Fifty samples of size were randomly selected from the census data and the sample means recorded.
The histogram that most likely represents the distribution of the sample means is
WORKED SOLUTION
1 markAnswer D
ANSWER
D
Worked solution
The sampling distribution of should be centred near the population mean and, for samples of size , should be more nearly normal and much less spread out than the original household distribution. Option D has those features.
Selects option D.
Worked explanation by QCE Vault; correct option verified against the QCAA answer key.
View the full QCAA marking guide