Q6 · 2022 · Technology-freeSimple familiar1 mark
QUESTION 6
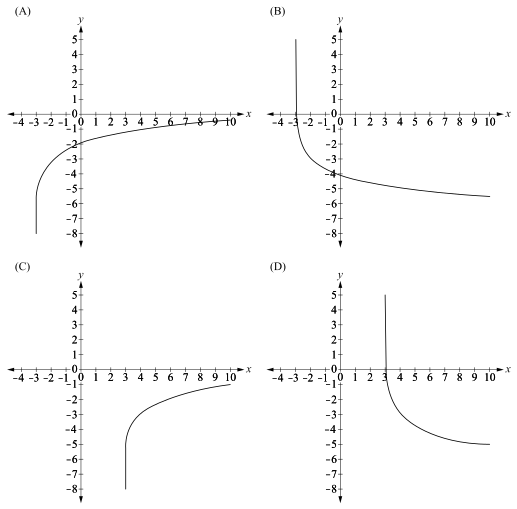
Which graph represents the function ?
(A)
Graph A
(B)
Graph B
(C)
Graph C
(D)
Graph D
WORKED SOLUTION
1 markAnswer B
ANSWER
B — Graph B
Worked solution
The domain is , so there is a vertical asymptote at . Also , so the graph is decreasing. This is graph B.
Selects option B.
Worked explanation by QCE Vault; correct option verified against the QCAA answer key.
View the full QCAA marking guide