Q199 · Practice questionTechnology-freeComplex familiar4 marks
QUESTION 199 (4 marks)
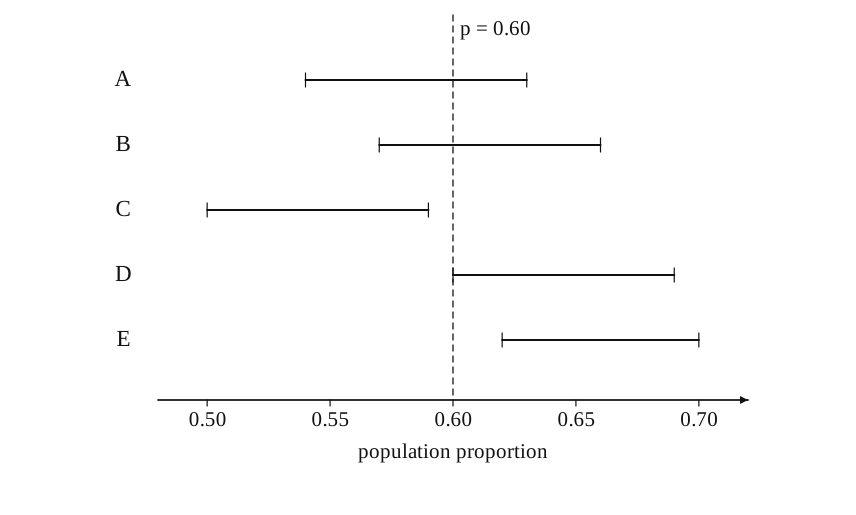
Five confidence intervals, A–E, are shown together with the true population proportion .
(a) Identify the intervals that do not contain .
(b) Explain the meaning of a 95% confidence level in the context of repeated random sampling.
WORKED SOLUTION
4 marksPractice marking scheme
ANSWER
(a) C and E. (b) In repeated random sampling using the same method, approximately 95% of the intervals constructed would contain the true population proportion.
Worked solution
From the diagram, intervals C and E lie entirely away from ; the other three contain (D includes it at the endpoint). A 95% confidence level describes the long-run success rate of the interval-construction procedure, not a probability assigned to the fixed parameter after one interval is computed.
Correctly identifies interval C.
Correctly identifies interval E.
Refers to repeated random sampling / repeated intervals.
Correctly states the approximately 95% long-run capture rate.
Practice question aligned to the current QCAA syllabus; review the worked solution and marking criteria.
View the QCAA syllabusHow many marks did you earn?
Compare your working with the guide above.