QCEVault

Continuity of life on Earth — Question 9

QCAA 2025, Paper 2 · 2 marks

Q9 · 2025 · Paper 2Unclassified2 marks

QUESTION 9 (2 marks)

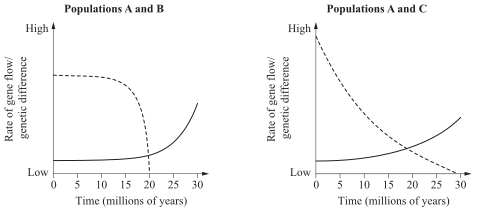
Scientists analysed data on three populations (A, B and C) in a region affected by habitat fragmentation. The graphs show how the rate of gene flow and genetic differences between the populations changed over time.
Biology question figure

Key rate of gene flow genetic difference

Infer which populations underwent allopatric speciation. Justify your response.

Related questions

  1. Q6 · 2025 QCAA · Paper 1 · 1 mark
    QUESTION 6 A student investigating the impact of a selection pressure on a population collected the data shown. Genotype BB Bb bb Number of individuals 128 220 85 Calculate the frequency of the recessive allele in the population. (A) 10% (B) 20% (C) 32% (D) 45%
    Continuity of life on Earth
  2. Q8 · 2025 QCAA · Paper 1 · 1 mark
    QUESTION 8 Speciation is more likely to occur between two populations when (A) gene flow is low and selection pressures are similar. (B) gene flow is high and selection pressures are similar. (C) gene flow is low and selection pressures are different. (D) gene flow is high and selection pressures are different.
    Continuity of life on Earth
  3. Q13 · 2025 QCAA · Paper 1 · 1 mark
    QUESTION 13 The cladogram shows relationships for species P, Q, R, S and T. P Q R S T hair amniotic egg four limbs backbone What inference can be drawn? (A) Species Q, R and S form a clade. (B) Species P and R are more closely related than species P and T. (C) The most recent common ancestor of species R and T had four limbs. (D) Species Q and R have a m…
    Continuity of life on Earth
  4. Q17 · 2025 QCAA · Paper 1 · 1 mark
    QUESTION 17 Which mode of evolution involves the development of complementary characteristics in two species experiencing a close and long-term interaction? (A) coevolution (B) parallel evolution (C) divergent evolution (D) convergent evolution
    Continuity of life on Earth