QUESTION 22 (4 marks)
The graph shows the effect of a selection pressure on the body length of a fish population.
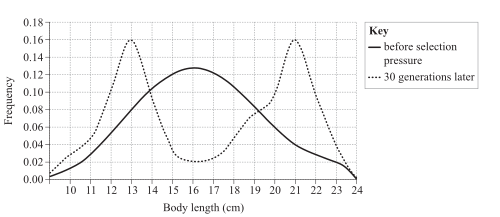
a) Determine which type of phenotypic selection has occurred.
[1 mark]
b) Use the principles of natural selection to explain the observed trends.
[3 marks]
QCAA guide · typeset solution
QCAA sample response and mark allocation
22a) | Disruptive selection | • determines disruptive selection [1 mark] |
22b) | The selection pressure provided a selective advantage to fish with body lengths around 13 cm and 21 cm. These fish had an increased chance of surviving to reproduce and pass on the trait, leading to an increase in these phenotypes from ~8% and ~4% before the selection pressure to ~16% after. Fish with intermediate phenotypes (~15–18 cm) were selected against, causing their relative frequencies to decrease over time. | • explains the observed trends, referring to - phenotypic variation [1 mark] - differential survival and reproduction [1 mark] - change over time [1 mark] |
QCAA sample response and marking criteria reproduced from the official guide.
Compare your working with the guide above.