Q7 · 2023 · Paper 1Unclassified1 mark
QUESTION 7
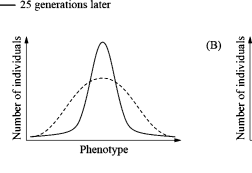
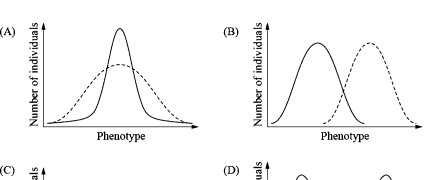
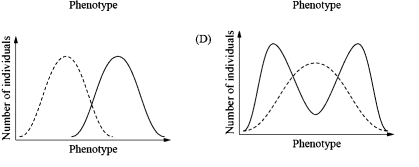
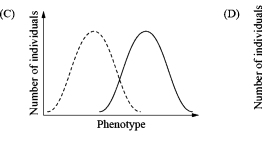
The distributions of phenotypes before and after a selection pressure acted on a population are shown.
Which graph shows disruptive selection?
Key ciate Before selection pressure
WORKED SOLUTION
1 markAnswer D
OFFICIAL ANSWERD
QCAA awards 1 mark for selecting option D.
Correct option from the official QCAA answer key.