Q4 · 2022 · Paper 1Unclassified1 mark
QUESTION 4
The graph shows the effect of a selection pressure on a hypothetical population.
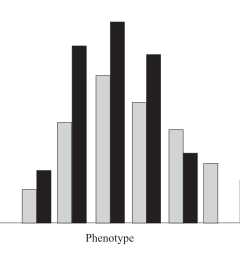
Key Before the selection pressure
Number of individuals
20 generations later
Which mode of phenotypic selection corresponds with the data?
(A) negative
(B) disruptive
(C) stabilising
(D) directional
WORKED SOLUTION
1 markAnswer C
OFFICIAL ANSWERC
QCAA awards 1 mark for selecting option C.
Correct option from the official QCAA answer key.