QUESTION 27 (3 marks)
The table shows the percentage sequence similarity for three different parts of a gene found in four different eukaryotic species. The data was obtained by comparing DNA from one member of each species to Species A. From this data, a proposed phylogenetic tree was produced.
Species | Gene region 1 | Gene region 2 | Gene region 3 |
A | 100% | 100% | 100% |
B | 98% | 96% | 82% |
C | 99% | 92% | 96% |
D | 99% | 99% | 92% |
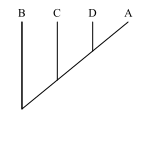
Determine whether the phylogenetic tree has been drawn correctly based on the DNA comparison. Explain your reasoning.
QCAA guide · typeset solution
QCAA sample response and mark allocation
27 | The phylogenetic tree is correct. In order of percentage differences compared to A, D is 10% different across the three gene regions, C is 13% different and B is 24% different. | • determines that the tree is correct [1 mark] • describes the order of percentage differences between species [1 mark] • provides relevant data from the table [1 mark] |
QCAA sample response and marking criteria reproduced from the official guide.
Compare your working with the guide above.