Q18 · 2020 · Paper 1Unclassified1 mark
QUESTION 18
The diagram shows the abundance (n) of phenotypic and genotypic variation for the colour trait of a species of butterfly.
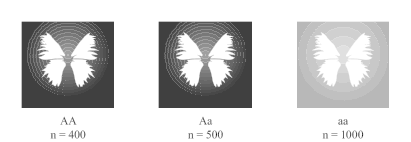
If these butterflies were placed in an environment with light-coloured trees, which option from the table would be the most likely effect on the allelic frequencies?
Frequency of allele/genotype | ||||
A | a | AA | aa | |
(A) | increase | decrease | ||
(B) | increase | no change | ||
(C) | decrease | increase | ||
(D) | no change | increase | ||

WORKED SOLUTION
1 markAnswer C
OFFICIAL ANSWERC
QCAA awards 1 mark for selecting option C.
Correct option from the official QCAA answer key.